|
    
Previous
Page |
Noesis Main Page
| Next Page
Noesis
Advanced Waveform Management & DSP
The
data stored in Acoustic Emission data files often contains a compressed form of
the information (or parts of it) in the form of Acoustic Emission features
extracted from waveforms and, thus, there is always some information loss.
Waveforms are the complete information of the Acoustic Emission produced during
an actual test or laboratory experiment. Fast, real time Acoustic Emission
systems are required to retrieve and store waveform information. Noesis
has full support for importing waveform information stored in PAC DTA, TDA
or WFS acoustic emission data files from PCI-2,
DiSP etc systems. In addition Noesis supports
ASCII waveforms with the TXT module. With the Advanced Waveform
Management functions in Noesis, these capabilities are dramatically
enhanced offering many new functions. The viewing capabilities of waveforms are
similar and as flexible as general data viewing graphs and they include FFT
transformation, filtering, windowing and other tools to investigate the complete information of the
received signal. Noesis offers a large array of functions starting from viewing
capabilities (e.g. multiple waveform viewing, zooming etc.) to Waveform
Feature Extraction both in time and frequency domains including some
features unique to Noesis and multiple hit
extraction per waveform. These can drastically improve the user's insight to
data types and improve
Pattern Recognition,
utilizing the new unique features extracted from Noesis. For TDA files features
can be extracted and a complete feature set created (with Time of
arrival to any feature desired) rendering TDA files usable by any advanced
feature (e.g. Pattern Recognition). The following is a brief list of the
capabilities of Noesis in waveform handling :
-
Waveforms can be displayed in
any window view. Multiple waveforms can be displayed in any view.
Waveform views are fully customizable. -
Advanced waveforms viewing
including graphical filtering. -
3D presentation of
multiple waveforms or waveform FFTs. -
Digital Signal Processing
on waveforms (FFT Real, Imaginary, Magnitude, Phase, Power Spectrum). -
Graphical and Box (Range) Zoom
functions for all waveform and FFT views including selection range
synchro, auto-scale, and user-range. -
Waveform filters can
be applied to graphics or to feature extraction. -
RMS waveform
calculation and Autocorrelation. -
Segment FFT
views where the user can select a segment of the
waveform and view the corresponding FFT, Power
Spectrum etc. The Segment can be defined and used in
Feature Extraction as well. -
Data selection from
waveform views including logical modes. -
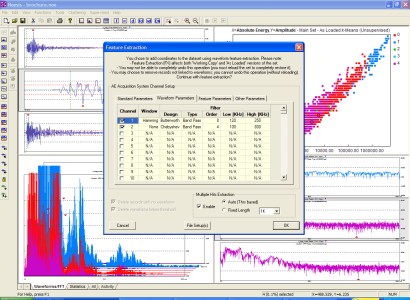
Individual waveform feature
extraction with comparison table with existing features. For more
information about complete file feature extraction see the
Data Handling page.
|