|
    
Previous
Page |
Noesis Main Page
| Next
Page
Noesis
Data Viewing Capabilities

view
large
Acoustic Emission
users are used to performing a large part of their analysis based on graphs.
Noesis provides them now with the tools to make this analysis faster, easier
and more effective as it implements capabilities which drastically improve the
users insight to the data. Some of the graph capabilities are specific to
acoustic emission data (e.g. Time Driven Data) but most of them apply to ASCII
files as well. Screen configurations can also be saved in a separate document
which can then be used with any data file(s). The following is a small list of
the large array of Noesis data viewing capabilities (for waveform viewing
capabilities see the
Waveforms & DSP page):
 |
 |
|
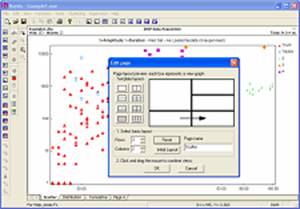
Page setup dialog. After setting up the
basic layout the user can use the mouse to merge views
in order to achieve custom layouts without complicated
tools. |
Screens like this are easily arranged without having to
move floating windows about or stretch them to fit.
Everything is done automatically to get a page layout
that fits the screen size available. |
-
Noesis supports scatter, line,
bar, cumulative plots as well as tabular active views of any
data set. Plots including density coloring
(amount of data in certain areas of the plot) and
various bin modes for binned plots (e.g. max,
ave, sum etc) are available. -
All plots are fully customizable
with minimum effort through advanced properties dialogs. -
The Data View (table with the data)
can be fully customized resulting in the most flexible numerical presentation
of the data. -
The Custom Page Interface
function allows the user to create pages and choose
their layout effortlessly making working with Noesis
easy and productive. All page customization is done
through a dedicated Properties dialog and the workspace
saved in a NWL file.
-
Noesis graphics allow all changes
to reflect on all plots immediately (e.g. data selection). -
Any number of windows (containing
up-to 4 views each) can be displayed, limited only by the display capabilities
of the hardware. -
Zoom
using On-Plot mouse selection or manual range setting.
-
Plot Panning
so that data can be investigated in detail without
unnecessary zoom-in, zoom-out functions.
-
Reverting to complex graph setups is
made simple through the Noesis Workspace Layout file
save/load capability.
-
Simple copy/paste plot properties
and pages
function generates duplicate plots with great ease.
-
Data can be viewed in normal
space, logarithmic or in maximum separation space (see
Data Handling).
-
Special functions for Event graphs,
including hit sequence and group selection (applied
to any plot) and area plots (X-Y-Z) for location
results presentation.
Download Information About Noesis in PDF
Format
|